EDF Power the games live
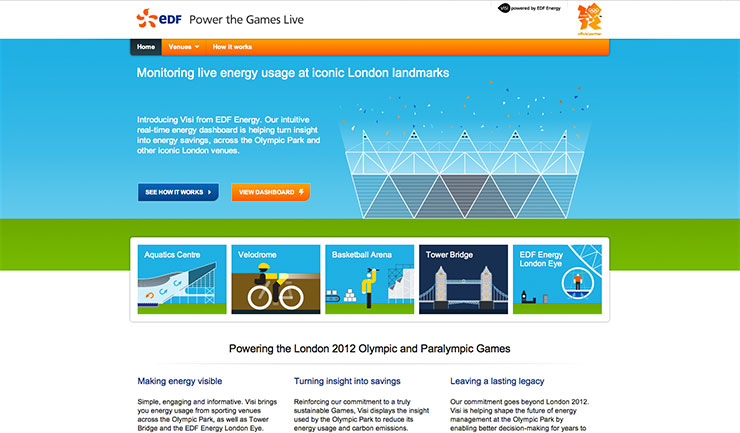
Visit websiteThe London 2012 games promised to be the greenest games yet, and as the official energy supplier, EDF played an important role in delivering on that promise. EDF approached Applied Works to create a web interface allowing the public to view real time and historic energy usage at the olympic venues, Tower Bridge and the EDF London Eye. The solution had to work across all browsers and devices whilst still taking advantage of the latest HTML5 features to create a rich and dynamic user experience.
Behind the scenes, the project takes real time energy data from smart meters at all the locations. Some locations were accessed via ethernet, others via GPRS resulting in varying levels of latency and data loss that had to be accounted for and repaired automatically in real time.
In addition, there were several other data feeds such as weather, events and bridge lifts to be incorporated into the data set, each posing their own set of technical constraints and challenges. With three years of data aggregated into 5 minute intervals, we needed to implement our own caching system to dramatically reduce the amount of database queries and make efficient use of the single server hosting the project.
With data coming in every minute, cron jobs were employed to keep averages up to date whilst keeping database queries to a level the server could handle during periods of heavy traffic.
As technical director on this project, it was my job to create the initial prototype front-end and back-end. I then handled the implementation of the production back-end and co-ordinated the incoming data from several sources. I also developed the responsive and resolution independent front-end for mobile.
EDF now offer a version of this project to their commercial customers, helping employees see the impact of their energy usage in realtime and to see the impact seasonal changes such as cold weather and rain has on a companies energy usage and carbon foot print.
-

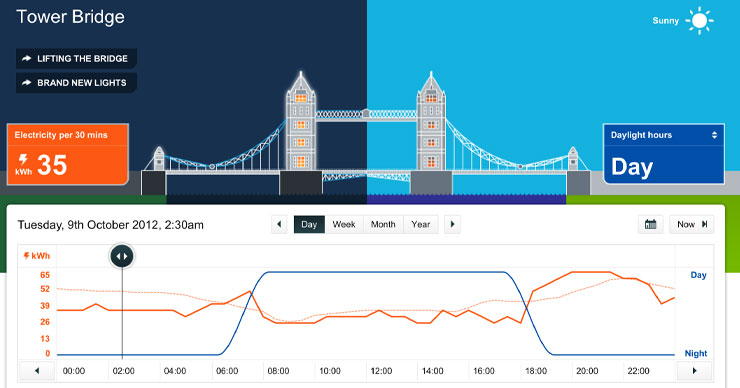
The dashboard provides an intuitive way for users to see energy usage in day, week, month and year view. The graph can also show contextual data such as rainfall or daylight hours over energy data.
-


There are six venues to choose from across London, each with their own 'energy stories'.
-

The illustrations, created by Peter Grundy, change to reflect day and night as the user interacts with the graph.
-

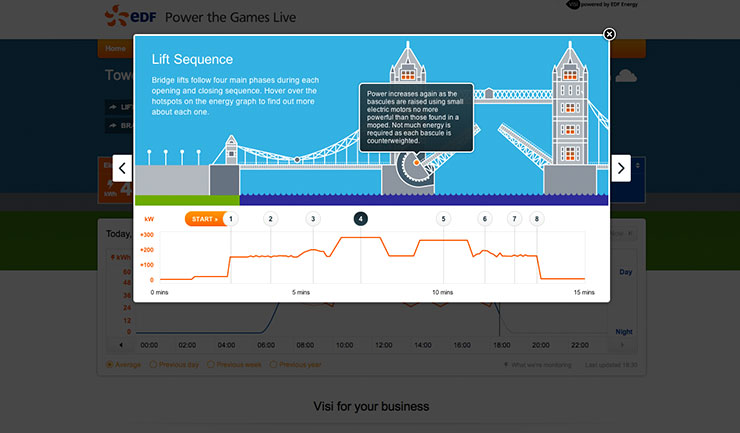
Event popovers provide context to help users understand the causes behind variations in energy usage.
-

A flexible and resolution independent front end was created to mobile devices with smaller screens.
